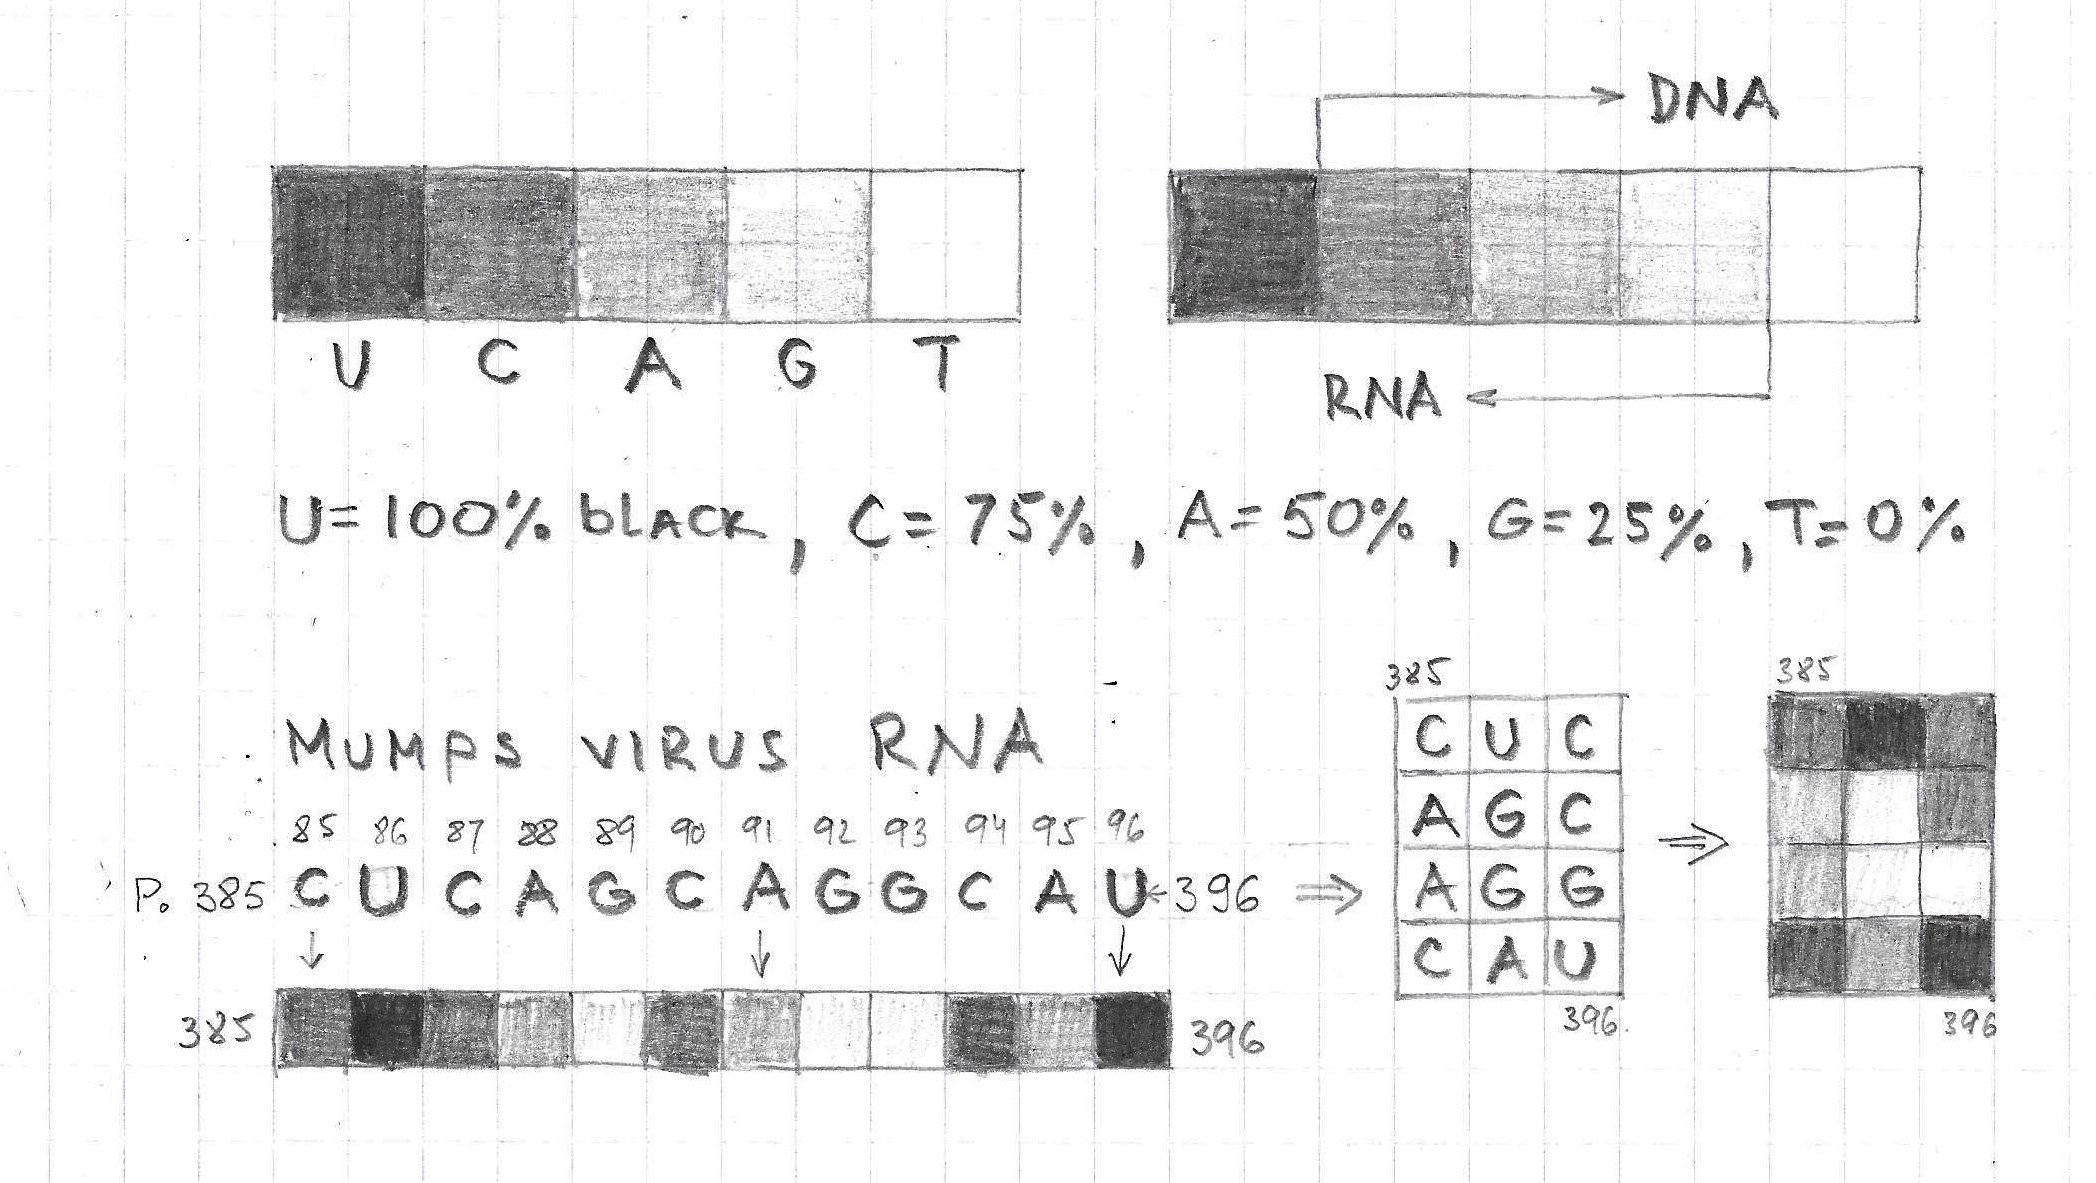
This particular visualization of Mumps RNA is based on the idea that all RNA/DNA basis could be
represented as five discrete values of the gray-scale: U=black(100%), C=dark(75%), A=gray(50%), G=light(25%) and T=white(0%), while the linear RNA structure could be converted into 2D images built of 3×4 basic matrices(fig.1). In this representation the value difference between neighboring basis is 25% and between the base-pairs it is 50%.
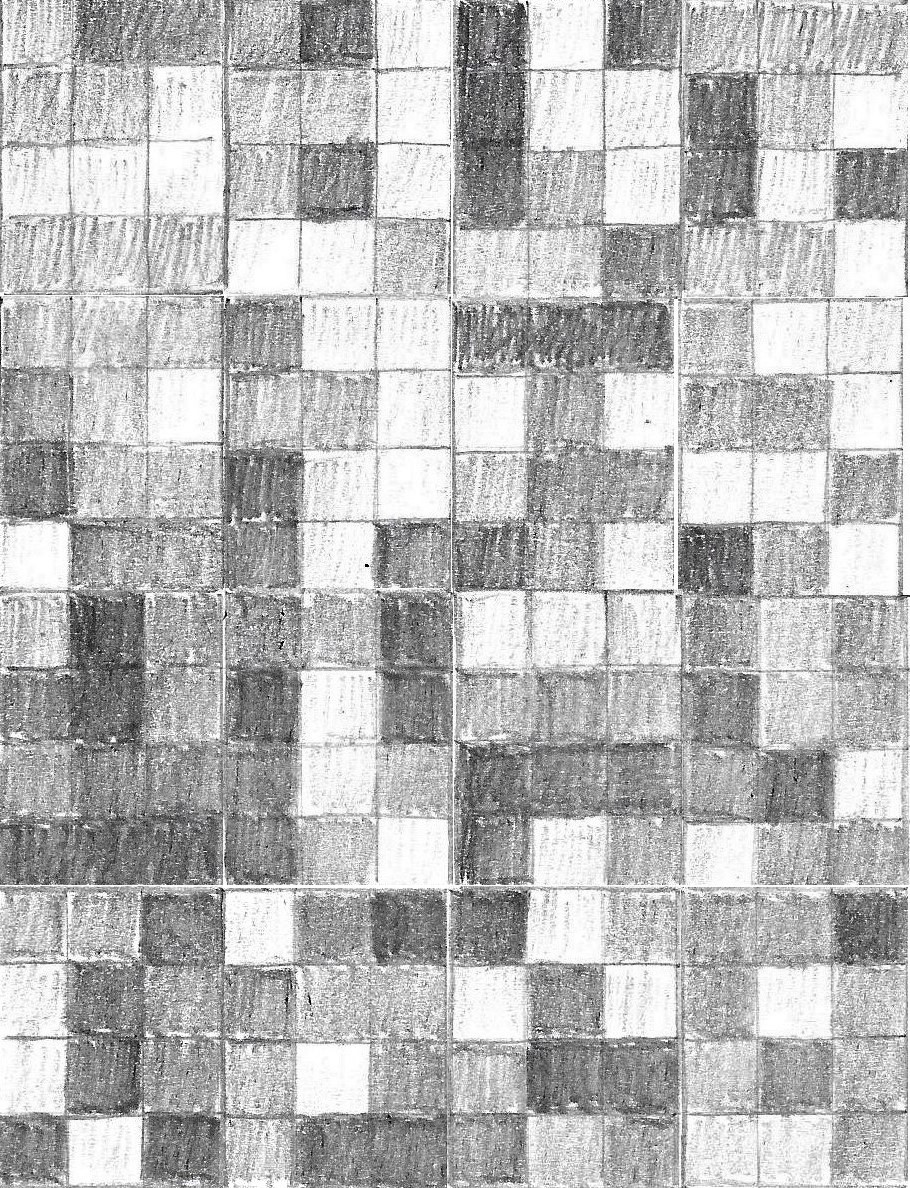
On the next two images it is illustrated how this algorithm is implemented on the first 192 positions of the Mumps RNA, first as a set of individual 3×4 matrices: micro-visualization(fig.2) and then as one integrated image: macro-visualization(fig.3). In this way it is be possible to compare patterns on the images representing different sequences, or to analyze the distribution of light and dark areas.
Gregor Mobius | gregor.mobius@jps.net

Recent Comments